


Level: Medium
Goal: Work with high-frequency ICU/OR vital signs via VitalDB library.
Dataset & Library
- VitalDB: PhysioNet - https://physionet.org/content/vitaldb/
- Python Library:
vitaldb- https://vitaldb.net/docs/
Installation
pip install vitaldb
Data Loading
import vitaldb
import pandas as pd

vf = vitaldb.VitalFile(1)  # example case 1
tracks = ["SNUADC/ECG", "Solar 8000/ART1"]

vals, t = vitaldb.vital_recs(vf, track_names=tracks, return_datetime=True)
df = pd.DataFrame(vals, columns=["ECG", "ART"])
df["Time"] = t
df = df.set_index("Time")
Implementation Steps
1. Library Setup and Data Access
- Install vitaldb library
- Explore available cases and tracks
- Select appropriate case(s) for analysis
- Understand data structure and sampling rates
2. Data Exploration
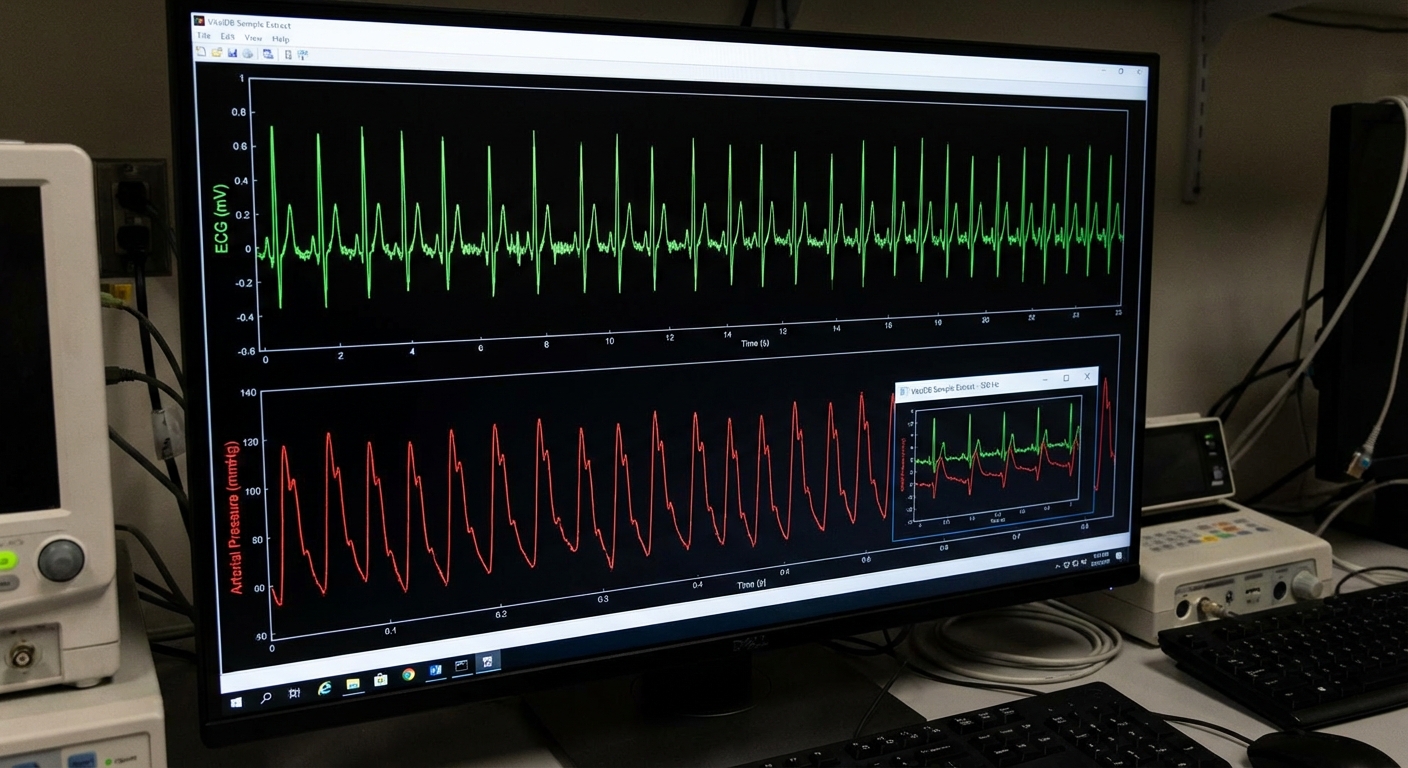
- Load high-frequency vital signs (ECG, arterial pressure, etc.)
- Inspect sampling rates (typically very high, e.g., 100+ Hz)
- Examine data quality and artifacts
- Identify available time ranges
3. Data Preprocessing
- Downsampling (if needed):
- High-frequency data may need downsampling for time series analysis
- Use appropriate resampling method
- Artifact Removal:
- Identify and handle artifacts (noise, spikes)
- Apply filtering if needed (low-pass, band-pass)
- Missing Data:
- Handle gaps in recording
- Interpolate or segment appropriately
4. Exploratory Data Analysis (EDA)
- Plot high-resolution signals
- Analyze signal characteristics (amplitude, frequency content)
- Calculate basic statistics
- Identify patterns and events
- Perform time series decomposition (may need adapted methods for high-frequency data)
5. Feature Extraction (Optional)
- Extract relevant features (e.g., heart rate from ECG, systolic/diastolic from arterial pressure)
- Calculate derived metrics
- Create lower-frequency time series for modeling
6. Model Building
- High-Frequency Analysis:
- Consider specialized methods for high-frequency data
- May need to work with derived features rather than raw signals
- Lower-Frequency Models:
- Extract features (e.g., mean HR per minute)
- Apply ARIMA/SARIMA to feature time series
- Event Detection (advanced):
- Detect specific events (arrhythmias, pressure changes)
- Model event occurrences
7. Model Evaluation
- Split data temporally
- Generate forecasts
- Calculate accuracy metrics
- Visualize results
- Compare with clinical expectations
8. Clinical Interpretation
- Interpret results in ICU/OR context
- Discuss implications for monitoring
- Identify clinically relevant patterns
- Compare with medical knowledge
Expected Deliverables
EDA Report:
- High-resolution signal plots
- Feature extraction results
- Statistical summaries
- Pattern identification
Model Results:
- Selected models and parameters
- Forecast accuracy
- Visualization of results
- Clinical interpretation
Code:
- Complete Python notebook
- Functions for data loading and preprocessing
- Feature extraction utilities
- Visualization tools
Tips
- High-frequency data requires different approaches than standard time series
- Consider extracting features (e.g., heart rate) rather than modeling raw signals
- Downsampling may be necessary for standard time series methods
- Handle artifacts carefully - they may be clinically significant
- Use appropriate filtering for signal processing
- Consider event-based analysis in addition to continuous forecasting
- Document sampling rates and preprocessing steps clearly
- High-frequency data can be computationally intensive - optimize code
- Consult clinical literature for appropriate analysis methods