


Topic 4
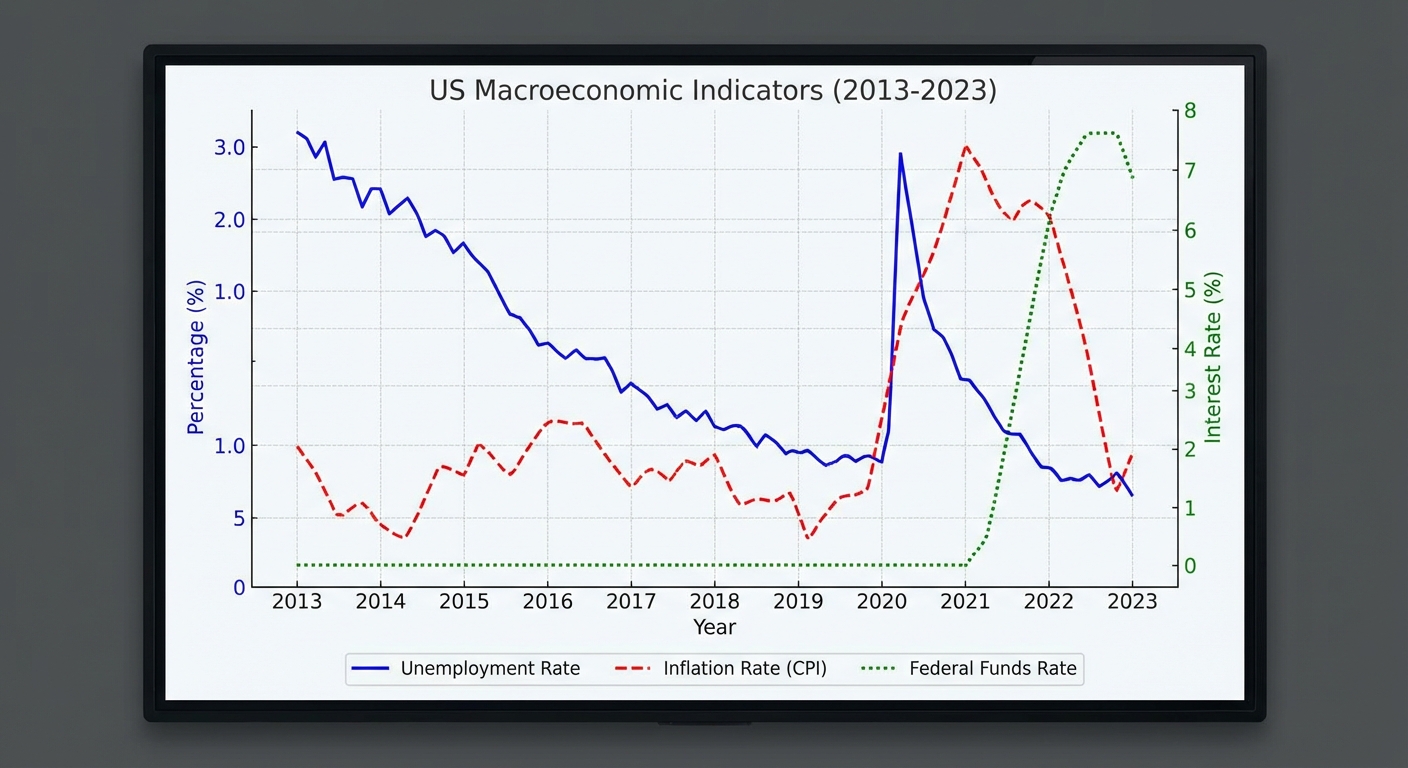
US Macroeconomic Indicators
Medium
+1 Bonus Point
Topic 4 – US Macroeconomic Indicators (Kaggle)
Level: Medium Goal: Model and forecast key US macro indicators (unemployment, inflation, etc.).Dataset
- Source: U.S. Economic Time Series – Kaggle
- Link: https://www.kaggle.com/datasets/utkarshx27/us-economic-time-series
Download Instructions
- Open the dataset link above.
- Click "Download".
- Extract to
data/. - Use the main CSV, e.g.
USEconomicData.csv.
Data Loading
import pandas as pd
df = pd.read_csv("data/USEconomicData.csv")  # adjust filename
df["DATE"] = pd.to_datetime(df["DATE"])
df = df.set_index("DATE").sort_index()
Implementation Steps
1. Data Exploration
- Load dataset and explore available indicators
- Select key indicators to analyze (e.g., unemployment rate, inflation, GDP, interest rates)
- Inspect data frequency (monthly, quarterly, annual)
- Check for missing values and data quality issues
2. Exploratory Data Analysis (EDA)
- Plot each selected indicator over time
- Identify trends, cycles, and structural breaks
- Calculate correlations between indicators
- Perform time series decomposition for each series
- Analyze ACF/PACF for each indicator
3. Stationarity Analysis
- Test each indicator for stationarity (ADF test)
- Apply appropriate transformations (differencing, log transformation)
- Handle non-stationarity appropriately
- Document transformation decisions
4. Model Building
- Univariate Models:
- ARIMA/SARIMA for each indicator individually
- Model selection using AIC/BIC
- Multivariate Models (optional):
- VAR (Vector Autoregression) models
- Analyze relationships between indicators
- Granger causality tests
5. Model Evaluation
- Split data temporally (keep recent data for testing)
- Generate forecasts for each indicator
- Calculate forecast accuracy metrics (MAE, RMSE, MAPE)
- Compare univariate vs multivariate approaches
- Visualize forecasts with actual values
6. Economic Interpretation
- Interpret model results in economic context
- Discuss relationships between indicators
- Analyze forecast implications
- Compare with economic theory
Expected Deliverables
- EDA Report:
- Time series plots for each indicator
- Correlation analysis
- Decomposition plots
- Stationarity test results
- Model Results:
- Model parameters for each indicator
- Performance metrics table
- Forecast plots
- Economic interpretation
- Code:
- Complete Python notebook
- Functions for indicator analysis
- Visualization utilities
Tips
- Macroeconomic indicators often have strong trends and cycles
- Consider external factors (recessions, policy changes) in analysis
- VAR models can capture relationships between indicators
- Use appropriate frequency (monthly vs quarterly) based on data availability
- Economic indicators may have different units - normalize for comparison
- Consider leading/lagging relationships between indicators
- Document economic context and policy implications
Starter Notebook
The starter notebook contains installation instructions and data loading code to help you get started with this topic.
Note: You can view the notebook directly on GitHub or download it to run locally in Jupyter.
Getting Started
This topic includes:
- README.md - Detailed implementation guide (this page)
- starter.ipynb - Jupyter notebook with installation and data loading code
- Featured image - Visual representation of the topic
Navigate to the Topic/4.US_Macro/ directory to access all resources.